The Purpose of RSI Dashboard
The RSI Dashboard is designed to give you a quick and comprehensive overview of the Relative Strength Index (RSI) for cryptocurrencies across multiple timeframes (e.g., 5m, 15m, 1h, 1d, 1w). This allows you to:
- Compare Instantly: See how a cryptocurrency’s RSI stacks up against the market average, providing insight into its relative strength or weakness.
- Sector Analysis: Use tags to compare a crypto’s RSI with others in the same sector (e.g., DeFi, Layer 1), helping you identify trends or opportunities within specific niches.
- Multi-Timeframe Insights: Analyze RSI across different periods to spot short-term momentum shifts or long-term trends, all in one glance.
Our goal is to simplify technical analysis, making it easy to assess market conditions and make informed decisions without diving into complex charts for every asset.
The Principle of RSI
The Relative Strength Index (RSI) is a momentum oscillator that measures the speed and magnitude of price movements. Developed by J. Welles Wilder Jr., it ranges from 0 to 100 and helps traders identify overbought or oversold conditions.
It’s calculated with this formula:
RSI = 100 - (100 / (1 + RS))
Where RS = Average Gain / Average Loss over a period (typically 14).
Key interpretations:
- Above 70: Overbought – potential for a price drop.
- Below 30: Oversold – potential for a price rise.
- 30–70: Neutral – no extreme momentum.
RSI reflects whether buying or selling pressure is dominating, making it a vital tool for timing entries and exits in trading.
RSI Divergences
The RSI was originally developed to detect zones and trends of overbought or oversold conditions, which is how the majority of traders use it. However, another powerful application of RSI is trading divergences, where the price and RSI move in opposite directions, often signaling potential reversals.
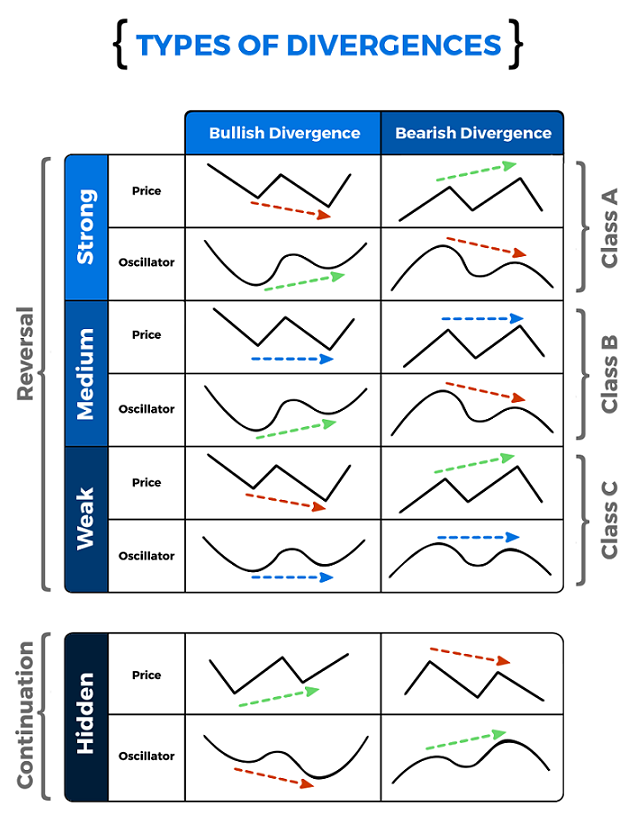
Bullish Divergence
A bullish divergence occurs when the price shows a downward trend or stability, but the RSI indicates increasing momentum, suggesting a potential upward reversal.
Strong
In a strong bullish divergence, the price decreases (making lower lows), while the RSI increases (making higher lows). This indicates strong buying pressure despite the falling price, often leading to a significant upward move.
Medium
In a medium bullish divergence, the price remains stable (neither rising nor falling significantly), but the RSI rises (showing higher lows). This suggests growing bullish momentum that may lead to a price increase.
Weak
In a weak bullish divergence, the price increases (making higher highs), but the RSI decreases (making lower highs). This indicates weakening momentum despite the rising price, which could still lead to a minor upward correction.
Bearish Divergence
A bearish divergence occurs when the price shows an upward trend or stability, but the RSI indicates decreasing momentum, suggesting a potential downward reversal.
Strong
In a strong bearish divergence, the price increases (making higher highs), while the RSI decreases (making lower highs). This shows weakening buying pressure despite the rising price, often leading to a significant downward move.
Medium
In a medium bearish divergence, the price remains stable (neither rising nor falling significantly), but the RSI decreases (showing lower highs). This suggests declining bullish momentum that may lead to a price drop.
Weak
In a weak bearish divergence, the price increases (making higher highs), but the RSI remains stable (neither rising nor falling significantly). This indicates a lack of momentum to sustain the upward move, potentially leading to a minor downward correction.
On our dashboard, you can spot divergences by comparing a crypto’s RSI with its price trends over different timeframes or against sector peers. This can help you catch early signs of trend changes that aren’t obvious from price alone.